Market Drawdowns
HISTORIC GLOBAL MARKET DRAWDOWNS
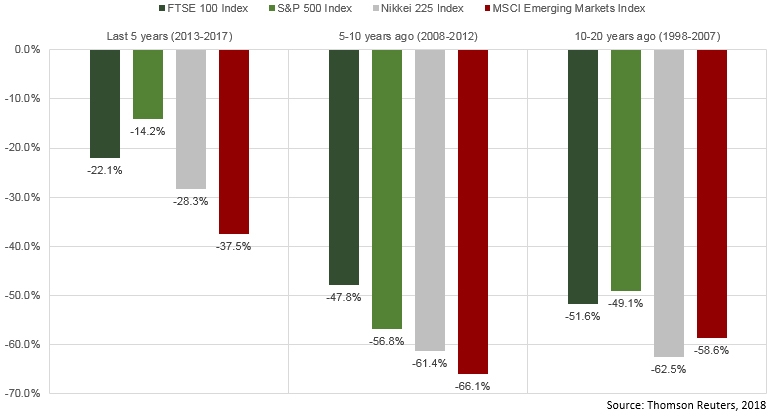
This chart shows the maximum peak to trough (high to low) drawdown during different 5 year time periods for four major global market indices representing the UK, US, Japan and Emerging Markets respectively.

The higher risk Emerging Markets index has experienced the greatest drawdown of the four select markets in two of the three defined time periods.
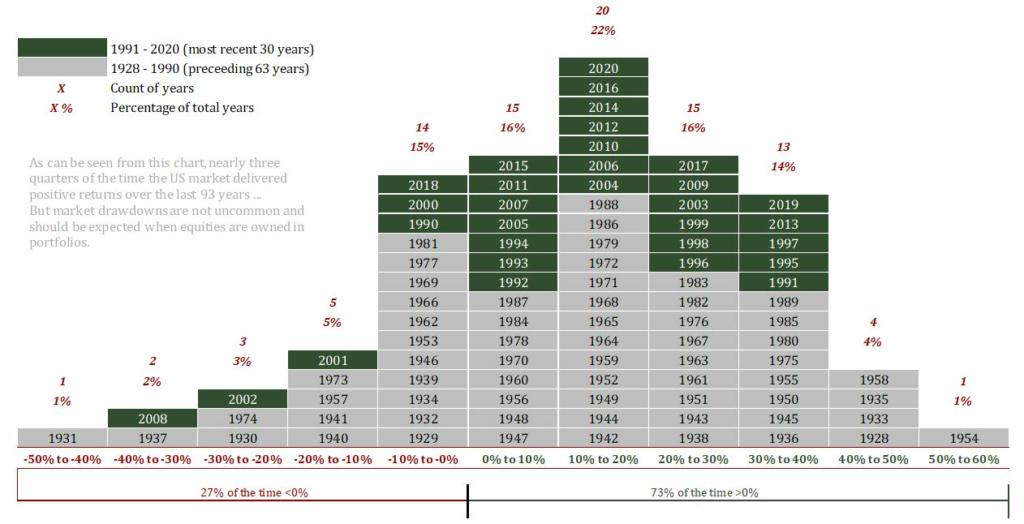
HISTORIC US MARKET DRAWDOWNS
As can be seen from this chart, nearly three quarters of the time the US market delivered positive returns over the last 90 years…
But market drawdowns are not uncommon and should be expected when equities are owned in portfolios.